What is a Circle Graph? Definition and Examples
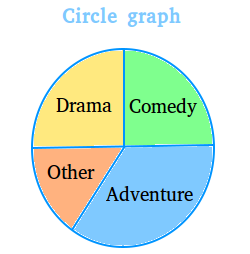
What is a circle graph? A circle graph is a graph that looks like a pie or circle. A circle graph shows information as fractions or percents of a whole.
The circle shows the total amount and it must be equal to 100% or 1.
A circle graph is also called pie graph or pie chart.
A real life example illustrating what a circle graph is and how to use it to answer questions
A survey was conducted asking people about the types of movies they like to watch. The circle graph below displays the result.

Now, answer the following questions:
1. Which type of movie is more popular than any other type?
2. Which two types of movies resulted into a tie?
3. Name a type of movie that is not as popular as adventure, comedy or drama.
Now, make an educated guess for the following questions:
4. What is the percentage of people who love drama? Comedy?
5. What is the percentage of people who love adventure?
6. What is the percentage of people that fell into other?
Click on "Show answer" only if you could not figure out the answers on your own.
Show answer