Definition of tree diagram and examples
A tree diagram is a connected, branching graph used to organize factors, probabilities, or outcomes so that these can be counted easily.

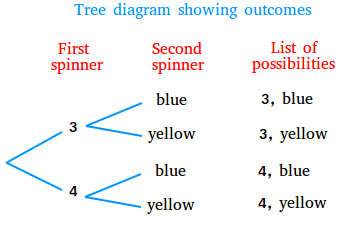
A tree diagram that can help to list outcomes
Suppose you have two spinners. The first spinner has the numbers 3 and 4 and the second spinner is half-blue and half-yellow. Find all possible outcomes if you spin the two spinners.

You can now see that there are 4 possible outcomes.
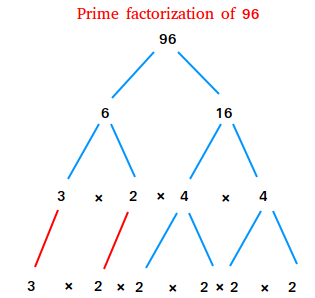
A tree diagram that can help to list the prime factors of a number
A tree diagram that can help you find all prime factors of a number is called factor tree.
Make a tree diagram to find all prime factors of 96.

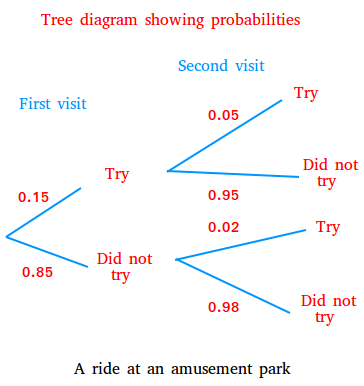
A tree diagram that can help to find probabilities
A person working for a amusement park made the following observations below about a specific ride.
Of all people, 15% will try the ride the first time they visit the park. of those who tried the ride on the first visit , only 5% will try the ride on the second visit. Of those who did not try the ride on the first visit, only 2% will try the ride on the second visit. Make a tree diagram showing the different probabilities. Then find the probability that someone who did not try on the first visit will try on the second visit.

The probability that someone who did not try on the first visit will try on the second visit = probability that someone did not try on the first visit multiplied by the probability that someone will try on the second visit if the person did not try on the first visit.
This probability is equal to 0.85 times 0.02 = 0.017.