What is an outlier ? Definition and examples
An outlier is a data value that is much greater or much less than the other data values.
Outliers can affect the mean of a group of data and how you interpret your data.
Example #1:
On a line plot, an outlier is a data value that is usually located some distance away from other data values.
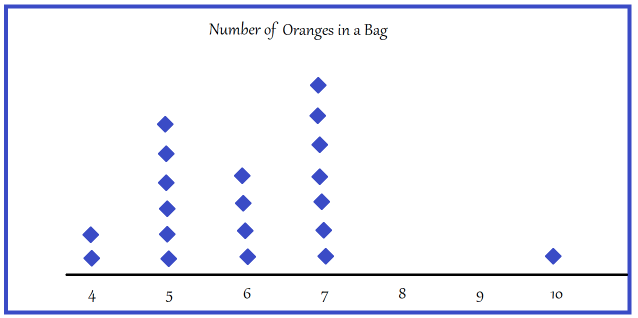
In the line plot below, 10 is an outlier.

10 is much greater than the other values and looking at the line plot, it is located some distance away from the other values.
How much does 10 affect the mean?
Find the mean with the outlier.
2 × 4 + 6 × 5 + 4 × 6 + 7 × 7 + 10 = 8 + 30 + 24 + 49 + 10 = 121
There are 20 values, so the mean is 121 / 20 = 6.05
Find the mean without the outlier.
2 × 4 + 6 × 5 + 4 × 6 + 7 × 7 + 10 = 8 + 30 + 24 + 49 = 111
There are 19 values now when we remove 10, so the mean is 111/19 = 5.84
The outlier raises the mean by 6.05 - 5.84 = 0.21.
Example #2:
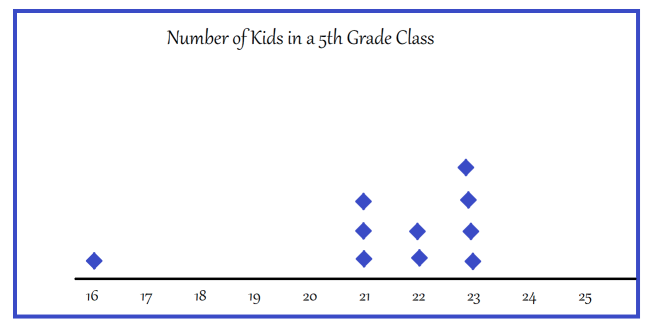
In the line plot below, 16 is an outlier.

16 is much smaller than the other values and looking at the line plot, it is located some distance away from the other values.
How much does 16 affect the mean? Find the mean with the outlier.
16 + 3 × 21 + 2 × 22 + 4 × 23 = 16 + 63 + 44 + 92 = 215
There are 10 values, so the mean is 215 / 10 = 21.5
Find the mean without the outlier.
3 × 21 + 2 × 22 + 4 × 23 = 63 + 44 + 92 = 199
There are 9 values now when we remove 16, so the mean is 199/9 = 22.11
The outlier decreased the mean by 22.11 - 21.5 = 0.61.
How can an outlier help you make good decision?
When an outlier increases or decreases the mean too much, you might decide that it is better to use the median to find the average.