Become math lovers!
3-Circle Venn Diagram - Definition and Examples.
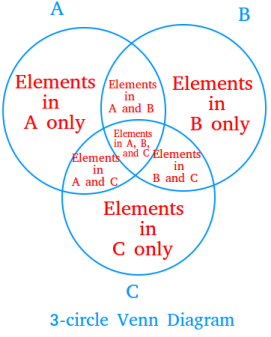
A 3-circle Venn diagram is a visual way to show relationship among sets using three circles.

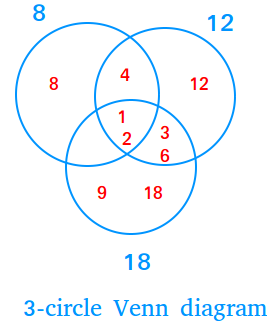
For example, the factors of 8 are 1, 2, 4, and 8. The factors of 12 are 1, 2, 3, 4, 6, and 12. The factors of 18 are 1, 2, 3, 6, 9 and 18.
We can create a Venn diagram that will show the sets of factors of 8, 12, and 18.

Notice that the factors that are the same for all three numbers ( 1 and 2
) are included in the overlapping region of the 3-circle Venn diagram.
Notice also how 8 and 18 have no factors that are the same. Thus, we put nothing in the overlapping region of 8 and 18.